Everyone in Nigeria knows bus fares went up. What is much less understood is by how much, on which routes, and why the increase was so uneven. Transita holds archived fare records alongside live ones for 30 corridors, which makes a direct before-and-after comparison possible on the same routes, the same operators and in many cases the same vehicles.
Key takeaways
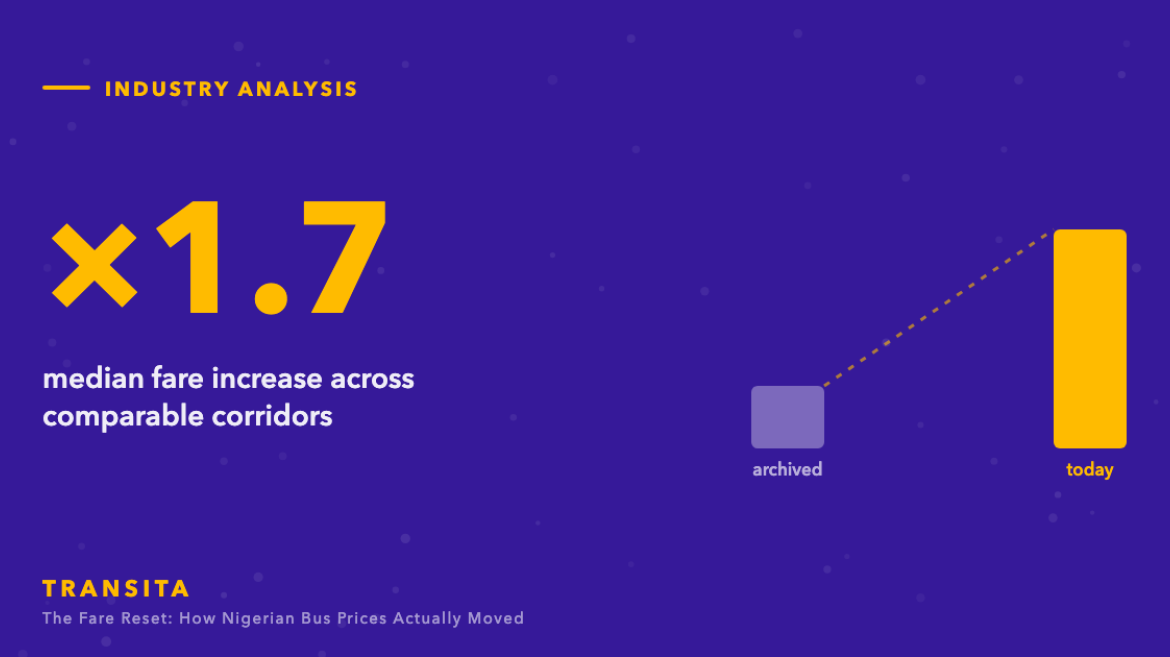
- Median fare increase across 30 comparable corridors: ×1.7.
- 10 corridors more than tripled; the steepest moved by ×4.8.
- The increase was not uniform — short corridors repriced far harder than long ones in percentage terms.
- On a minority of corridors, competition pushed the current fare below the archived one.
The numbers
These are averaged fares on identical city pairs, archived against current:
| Corridor | Archived average | Current average | Multiple |
|---|---|---|---|
| Asaba – Lagos | ₦8,970 | ₦43,075 | ×4.8 |
| Lagos – Uyo | ₦11,300 | ₦50,406 | ×4.5 |
| Lagos – Port Harcourt | ₦10,468 | ₦44,247 | ×4.2 |
| Aba – Lagos | ₦9,783 | ₦39,974 | ×4.1 |
| Abuja – Lagos | ₦11,915 | ₦48,172 | ×4.0 |
| Port Harcourt – Lagos | ₦11,100 | ₦43,628 | ×3.9 |
| Lagos – Warri | ₦9,208 | ₦35,384 | ×3.8 |
| Lagos – Benin City | ₦7,281 | ₦27,146 | ×3.7 |
| Benin City – Lagos | ₦8,027 | ₦28,103 | ×3.5 |
| Lagos – Abuja | ₦15,632 | ₦53,247 | ×3.4 |
| Lagos – Ekwulobia | ₦16,014 | ₦46,465 | ×2.9 |
| Lagos – Nnewi | ₦21,194 | ₦47,156 | ×2.2 |
| Lagos – Umuahia | ₦19,571 | ₦42,970 | ×2.2 |
| Owerri – Lagos | ₦24,745 | ₦44,291 | ×1.8 |
Why short routes repriced hardest
The pattern that jumps out is counterintuitive: the largest multiples are on the shorter, cheaper corridors, not the long-haul ones. Lagos–Benin City, at around 320km, moved by more than four times. Lagos–Abuja, at more than twice the distance, moved by less.
The reason is cost structure. On a short corridor the fare was already close to the floor — fuel, driver, terminal fee, and very little margin on top. When diesel and petrol repriced, there was nothing to absorb it, so essentially the entire increase went straight into the ticket. On long-haul premium services the fare carried more margin and more non-fuel cost, so the same input shock landed as a smaller proportional increase.
This has a distributional consequence worth stating plainly: the passengers who absorbed the largest percentage increases were disproportionately those on the cheapest, shortest, most price-sensitive journeys.
Where competition held the line
Not every corridor moved the same way, and the exceptions are informative. On corridors with four or five operators posting fares against each other, the spread between the cheapest and most expensive carrier stayed wide, and the fare floor rose more slowly than the average. On single-operator corridors — 74% of the network — there was no such brake. That is the clearest evidence in the dataset that competitive depth is doing real work on price.
What this means going forward
Two things. First, fares on this market are now fuel-indexed in a way they were not before, which means passengers should expect more frequent and more visible repricing rather than the long stable periods they were used to. Second, the value of fare comparison has gone up sharply. When the spread between the cheapest and most expensive operator on a corridor is ₦20,000, checking before booking is worth real money on every trip.
Compare live fares across every operator. Transita indexes every national carrier in one search.
Frequently asked questions
Why did Nigerian bus fares increase so much?
Fuel is the single largest input cost in intercity road transport, and the increase passed through almost directly into ticket prices. Corridors with thin margins before the shock repriced hardest, because there was no margin to absorb it.
Which routes had the biggest fare increases?
In percentage terms, the shorter corridors. Asaba to Lagos moved by the largest multiple in this dataset at ×4.8.
Will bus fares in Nigeria come down?
Fares now track fuel costs closely, so they will move in both directions rather than only up. The more reliable saving is comparing operators: on contested corridors the spread between carriers is often larger than any likely change in the average.