Nigerian intercity bus travel is one of the largest transport markets in Africa and one of the least measured. There is no regulator publishing route data, no equivalent of an airline schedule filing, and no public fare index. What exists instead is what the operators themselves put into their booking systems — and once you aggregate that across carriers, a fairly precise picture of the national network emerges.
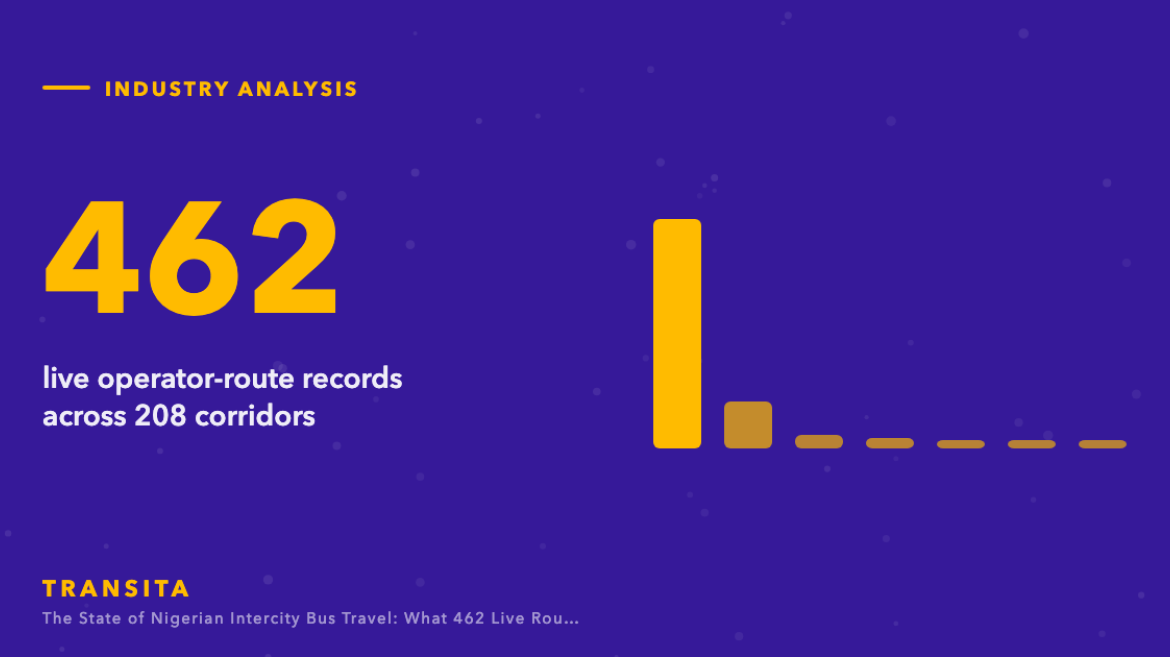
This is the first in a series of analyses built on the Transita schedule index: 462 live operator-route records covering 208 city-pair corridors, 323 terminals across 61 cities in 28 states, from 7 national operators. Everything below comes from live booking inventory, not from survey data or published brochure rates.
Key takeaways
- 462 live operator-route records across 208 corridors.
- 153 of 208 corridors (74%) are served by a single operator.
- 69% of corridors touch neither Lagos nor Abuja.
- The median fare works out at roughly ₦4,600 per hour of scheduled travel.
- Minibuses, not coaches, are the backbone: Hiace variants account for the largest share of scheduled vehicle classes.
The network is bigger and thinner than it looks
The headline number is 208 corridors. The more useful number is how few of them are contested. Of 208 city-pair corridors carrying live fares, 153 — 74% — have exactly one operator posting a price. Only 12 corridors have four or more.
That distribution is the single most important fact about this market. The public conversation about Nigerian bus travel is a conversation about the handful of trunk routes where four or five carriers slug it out. The actual network is a long tail of thin, single-operator links where the passenger has no alternative and the fare reflects it. We look at what that does to pricing in our analysis of single-operator corridors.
| Operators on corridor | Number of corridors | Share |
|---|---|---|
| 1 | 153 | 74% |
| 2 | 31 | 15% |
| 3 | 9 | 4% |
| 4 | 7 | 3% |
| 5 | 5 | 2% |
| 6 | 2 | 1% |
| 7 | 1 | 0% |
The most contested corridors
Where operators do compete, they compete hard. These are the corridors carrying the widest operator fields on the index:
| Corridor | Operators | Fare range | Carriers |
|---|---|---|---|
| Aba – Lagos | 7 | ₦23,000 – ₦50,700 | ABC Transport, Chisco Transport, Efex Transport, GIGM, GUO Transport, Libra Motors, Peace Mass Transit |
| Benin City – Lagos | 6 | ₦15,000 – ₦123,500 | ABC Transport, Efex Transport, GIGM, GUO Transport, Libra Motors, Peace Mass Transit |
| Lagos – Port Harcourt | 6 | ₦28,000 – ₦51,000 | ABC Transport, Chisco Transport, GIGM, GUO Transport, Libra Motors, Peace Mass Transit |
| Aba – Abuja | 5 | ₦28,000 – ₦54,050 | ABC Transport, Chisco Transport, GIGM, GUO Transport, Peace Mass Transit |
| Abuja – Lagos | 5 | ₦35,000 – ₦57,550 | ABC Transport, Chisco Transport, GIGM, GUO Transport, Peace Mass Transit |
| Abuja – Port Harcourt | 5 | ₦40,000 – ₦57,550 | ABC Transport, Chisco Transport, GIGM, GUO Transport, Peace Mass Transit |
| Lagos – Owerri | 5 | ₦27,000 – ₦66,000 | ABC Transport, Chisco Transport, GIGM, GUO Transport, Libra Motors |
| Lagos – Warri | 5 | ₦27,200 – ₦45,500 | ABC Transport, GIGM, GUO Transport, Libra Motors, Peace Mass Transit |
Note what is not at the top of that list. Lagos–Abuja, the corridor everyone names first, is not the most contested route in the country. The Lagos–Aba and Lagos–Owerri trade corridors carry more operators. Commercial traffic, not political traffic, is what draws carriers in.
The network is less Lagos-centric than the story suggests
69% of corridors on the index touch neither Lagos nor Abuja. The mental model of Nigerian bus travel as a wheel with Lagos at the hub is out of date — or at least incomplete. Regional links like Enugu–Port Harcourt, Benin–Owerri and the Abuja–southeast corridors carry real scheduled service at fares a fraction of the trunk routes. We take that apart in The network is not radial.
Fares have reset, not drifted
Comparing archived fare records against current ones on the same corridors, the median fare has moved by a factor of 1.7, and on 10 corridors by more than three times. This was not gradual inflation. It was a step change, and the pass-through was uneven — some corridors absorbed it and some did not. Full breakdown in The fare reset.
What this means for the market
Three things follow from the data. First, consolidation pressure is real: a market where 74% of routes are single-operator is a market where scale advantages compound. Second, the constraint on growth is not vehicles but inventory visibility — passengers cannot choose between operators they cannot see in one place. Third, the regional network is where the unserved demand is, and it is systematically under-timetabled relative to the trunk routes.
We will keep publishing against this index as it grows. If you work in transport policy, operations or investment and want to interrogate the underlying data, get in touch.
Search live fares across every operator on Transita. The same index these analyses are built on.
Frequently asked questions
How large is the Nigerian intercity bus market?
The Transita index currently tracks 462 live operator-route records across 208 corridors, 323 terminals, 61 cities and 28 states from 7 national operators. The true market is larger, since informal and unscheduled operators are not captured in booking inventory.
Which is the busiest bus route in Nigeria?
By operator competition, Lagos to Aba and Lagos to Owerri carry the widest operator fields on the index.
How much does intercity bus travel cost in Nigeria?
The median works out at roughly ₦4,600 per hour of scheduled journey time. In absolute terms, current fares run from around ₦3,500 on short regional links to over ₦100,000 on premium long-haul coach services.